
New Paper: Local factors mediate the response of biodiversity to land use on two African mountains
I know that it has been a while since I posted anything here. The daily responsibilities and effort required for my PhD program are taking quite a toll on the time I have available for other non-phd matters (for instance curating this blog). I apologize for this and hope to post some more tutorials and discussion post in the future. However at the moment my personal research reserved 105% of my available time. But the scientific blogosphere is generally in a bit of a crisis I heard.
Anyway, today I just want to quickly share the exciting news that my MSc thesis I conducted at the Center for Macroecology, Evolution and Climate has passed scientific peer review and is now in early view in Animal Conservation. I am quite proud of this work as it represents the first lead-author paper I managed to publish that involved primary research and data collection.
Short breakdown: During my masters and also now in my PhD I am extensively working with the PREDICTS database, which is a global project aiming at collating local biodiversity estimates in different land-use systems across the entire world. The idea for this work came as I realized that many of the categories in the PREDICTS database are affected by some level of subjectivity. Local factors – such as specific land-use forms, vegetation conditions and species assemblage composition – could alter general responses of biodiversity to land use that have been generalized across larger scales. Thus the simple idea was to compare ‘PREDICTS-style’ model predictions with independent biodiversity estimates raised at the same local scale. But see abstract and paper below.
Jung et al (2016) – Local factors mediate the response of biodiversity to land use on two African mountains
http://onlinelibrary.wiley.com/doi/10.1111/acv.12327/abstract
Abstract:
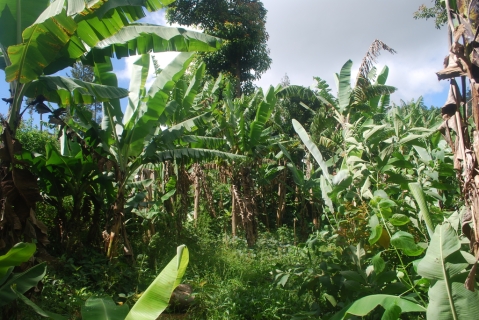
Land-use change is the single biggest driver of biodiversity loss in the tropics. Biodiversity models can be useful tools to inform policymakers and conservationists of the likely response of species to anthropogenic pressures, including land-use change. However, such models generalize biodiversity responses across wide areas and many taxa, potentially missing important characteristics of particular sites or clades. Comparisons of biodiversity models with independently collected field data can help us understand the local factors that mediate broad-scale responses. We collected independent bird occurrence and abundance data along two elevational transects in Mount Kilimanjaro, Tanzania and the Taita Hills, Kenya. We estimated the local response to land use and compared our estimates with modelled local responses based on a large database of many different taxa across Africa. To identify the local factors mediating responses to land use, we compared environmental and species assemblage information between sites in the independent and African-wide datasets. Bird species richness and abundance responses to land use in the independent data followed similar trends as suggested by the African-wide biodiversity model, however the land-use classification was too coarse to capture fully the variability introduced by local agricultural management practices. A comparison of assemblage characteristics showed that the sites on Kilimanjaro and the Taita Hills had higher proportions of forest specialists in croplands compared to the Africa-wide average. Local human population density, forest cover and vegetation greenness also differed significantly between the independent and Africa-wide datasets. Biodiversity models including those variables performed better, particularly in croplands, but still could not accurately predict the magnitude of local species responses to most land uses, probably because local features of the land management are still missed. Overall, our study demonstrates that local factors mediate biodiversity responses to land use and cautions against applying biodiversity models to local contexts without prior knowledge of which factors are locally relevant.
New paper: A first global assessment of remaining biodiversity intactness
Anthropogenic land use is one of the dominant drivers of ongoing biodiversity loss on a global scale and it has often been asked how much biodiversity loss is “too much” for sustaining ecosystem function. Our new paper in the journal Science came out last week and attempts to quantify for the first time the global biodiversity intactness within the planetary boundary framework. I am absolutely delighted to have contributed to this study and it received quite a bit of media attention so far ( https://www.altmetric.com/details/9708902 ) with a number of nice articles in the BBC and the Guardian.
Biodiversity intactness of ecological assemblages for species abundance. Source: Newbold et al. 2016
In our study we calculated the Biodiversity intactness index (BII) first proposed by Scholes and Biggs (2005) for the entire world using the local biodiversity estimates from the PREDICTS project and combined them with the best available down-scaled land-use information to date. We find that many terrestrial biomes are already well beyond the proposed biodiversity planetary boundary (previously defined and set as a precautionary 10% reduction of biodiversity intactness). Unless these ongoing trends are decelerated and stopped in the near future it is likely that biodiversity loss might corroborate national and international biodiversity conservation targets, ecosystem functioning and long-term sustainable development.
- Newbold, Tim, et al. “Has land use pushed terrestrial biodiversity beyond the planetary boundary? A global assessment.” Science 353.6296 (2016): 288-291. DOI: 10.1126/science.aaf2201
-
Scholes, R. J., and R. Biggs. “A biodiversity intactness index.” Nature 434.7029 (2005): 45-49. DOI: 10.1038/nature03289
New publication: LecoS now with own reference
As I can see my QGIS plugin LecoS is still widely used and downloaded from the QGIS plugin hub. I have noticed that some people already started referencing ether my blog or the QGIS repository in their outputs, which is fine, but after thinking about it for a while I thought why not make a little descriptive article out of it (being an upstart PhD scholar and scientist an’ all). I am now happy to announce that this article has passed scientific peer-review and is now been published in early view in the Journal of Ecological Informatics.
LecoS — A python plugin for automated landscape ecology analysis
The quantification of landscape structures from remote-sensing products is an important part of many analyses in landscape ecology studies. This paper introduces a new free and open-source tool for conducting landscape ecology analysis. LecoS is able to compute a variety of basic and advanced landscape metrics in an automatized way. The calculation can furthermore be partitioned by iterating through an optional provided polygon layer. The new tool is integrated into the QGIS processing framework and can thus be used as a stand-alone tool or within bigger complex models. For illustration a potential case-study is presented, which tries to quantify pollinator responses on landscape derived metrics at various scales.
The following link provided by Elsevier is still active until the 23 of January 2016. If you need a copy later on and don’t have access to the journal (sorry, I didn’t have the money to pay for open-access fees), then feel free to ether contact me or you can read an earlier prePrint of the manuscript on PeerJ.
http://dx.doi.org/10.1016/j.ecoinf.2015.11.006
So if you are using LecoS in any way for your work, it would be nice if you could reference it using the citation below. That shows me that people are actively using it and gives me incentives to keep on developing it in the future.
Martin Jung, LecoS — A python plugin for automated landscape ecology analysis, Ecological Informatics, Volume 31, January 2016, Pages 18-21, ISSN 1574-9541, http://dx.doi.org/10.1016/j.ecoinf.2015.11.006.
The full sourcecode of LecoS is released on github.
Get credit for your work!
Today I just want to share with you two (new – granted this one is already 2 years old) services that aim to make voluntary or open work more visible and credible. Many researchers often do a lot of work that is not really valued or even accounted for in academic hiring processes or funding proposals. Such as for instance the very process of participating as a (voluntary) reviewer for a peer-reviewed journal. Those of you who have done such a review know that it is often a tremendous amount of work (to do it properly). At least for me it costs several hours of work on a day that I could in return spend on my work instead. I am not criticising peer-review here ( also because of a lack of alternatives), but I often wondered if there is a way to get credit for your past peer-reviews. And there actually is a way as I have just found out. Publons is a website that allows you create a free profile page, where you can list your past reviews. They have a mailing verification system in place and are in direct contact with journals to check if you have actually done a review or not. You don’t have to publish the contents of your review, but you obviously can decide to do so (for instance if it was a particular well written study or just love embracing the openness). Give it a try.
The other service I want to introduce is called Depsy and was just started today. It a website that promotes innovative and highly used scientific software for researchers by scanning github, citations, download rates and dependencies. Why is that helpful and very important? Consider for instance that you developed a piece of software, make it openly available and even provide a reference so that users can cite you. However your work might just be incorporated into others (such as the rgdal package that just wraps up access to the gdal and proj4 libraries) or is not cited due to pure convenience. For instance I really wonder if most of the users of ggplot2 in R ever called citation(“ggplot2”) and actually cited it in their work. Depsy is dedicating open-source projects their own page ( here for instance the one for ggplot2), which evaluate the overall impact of the software and how it has been (re)used since its release. Very cool and nice idea and I hope that this new service will finally provide credit for all those programmers out there so that maybe one day creating open-source scientific software will be properly valued.
To all editors, reviewers and authors: time to move on regarding land sparing
Interesting read:
J. Fischer on the land-sharing/land-sparing debate.
By Joern Fischer
Synopsis of this blog post: We don’t need sparing or sharing but both; and how exactly this should happen in any given landscape requires a (more holistic) interdisciplinary approach to be answered. Editors, reviewers and authors should recognize this and prioritise work that goes substantially beyond trading off sparing vs. sharing.
It’s no great secret that I’m not the biggest fan of the framework on land sparing and land sharing – though I do recognize that it does have an academic value, and it is an internally consistent, elegant framework. Those who know how to use this framework carefully do good science with it. But most users over-interpret it, which I find increasingly upsetting. So this blog post is a call to editors, reviewers and authors to be more critical about fundamental assumptions that are regularly being made by many authors, but hardly ever spelt out, or…
View original post 793 more words
Android apps for researchers – My personal favourites
For a long time I have been kinda reluctant to jump on the Smartphone/Touchscreen train, which might be due to the fact that I am rather conservative with regards to software. In the same way I choose my Linux distribution (Debian for the extra stability and often outdated , but proofed versions), I prefer to choose the tools surrounding me. Stability and function always meant a lot more to me than cultural trends or taste. Nevertheless in the last month I decided to purchase my first device with a touchscreen, a tablet running Android for my daily use and so that I do not have to take the notebook with me during every travel. I have never really used sth. like this before so please excuse the following over exaggerated praises as this whole world of using apps (as in application) is pretty new to me. In the short time I used my new tabet, I already managed to find some really useful apps, which I would like to share with you (feel free to recommend others):
Doing any kind of research usually requires you to read broadly and read a lot! Most of the time I stumble across new literature by reading blogs, tweets and following researchers who work on similar issues related to mine. Of course I occasionally check out different journal homepages as well and scroll down the list of abstracts from the latest issues. Working or being registered at a scientific institution enables you to read papers from all kinds of journals, not only those directly related to your main field of research. I promptly registered to many journals including some that are only in a very general way related to my field of study. In Browzine published new issues are highlighted with a red dot, so you can be sure never to miss a new paper from your favourite journal. In addition you can save any downloaded papers directly to your dropbox or mendeley account. Cons: Some opensource journals (peerJ) and preprint hosters (biorxiv) are missing? Also it seems as if not every institution has made a deal with the app publisher.
This one probably is not a new one to you. Evernote has been around for a while and simply does a splendid job of organizing your thoughts. You can drop whole websites, simple txt’s and pictures together to build your own little collection of paste-it posts. I usually also keep their web interface open on my desktop PC and all notes are synchronized with my mobile device.
If you are not running windows / evernote on your production machine, than usually you go with ether Zotero or mendeley as literature management software of your choice. I got used to mendeley and their nice plugin for Libreoffice, which enables to insert and manage references directly from mendeley. This really paid off when I noticed that there is also a mendeley app, which syncs with your mendeley account. Why is that useful? Well, I can for instance manage all my references and tons of pdfs on my PC, sync them to my mendeley account and then have them readily available for reading and commenting on my mobile device. Not to mention that it integrates quite well with other providers such as the mentioned above Browzine.
Excellent file browser which I really would like to have open all the time. You can browse all the files on your device (even the hidden once), social and remote service (like cloud hoster, ftp or network servers) are integrated. The ES File explorer is organized in windows, which enables you to switch quickly between for instance your dropbox and pictures. Very good discovery!
- Google calendar and mail
I tried almost every calender and mail app that is available in the google play store, but in the end I still stuck with the default google calendar and mail. The reasons: Ease of navigations, no annoying adds or popups which want to persuade you to buy a “pro” version and especially working sync with a wide range of accounts, contacts and events(!). Obviously the google apps have kinda of a homeplay game on android compared to other alternatives. Having the same kind of interface for the calendar on both the tablet and my personal computer was really, what made the deal in the end. Google mail also is quite easy to use and manage, especially for people like me with multiple mail accounts.
This one is really handy, especially for people who often get lost. It lets you access the popular openstreemap maps and navigate through it with your touchscreen. If you enable GPS you can see your current location and calculate the optimal route to your destination. Out of internet? No problem, the app lets you download and store whole geographic regions so that you can access openstreetmaps mapping and routing even while you are have no internet. Quite good if you are lost on the way to a conference and don’t want to use your precious bandwidth.
This one is an output from the Jetz lab at Yale university. You can use the application to find out the species that you just saw on your morning stroll around the park/coast/reserve. Based on species range maps it calculates the number of species, which can be potentially discovered in the current area. The little pictures also help a lot with the identification.
That´s it. But feel welcome to comment and suggest other nice (free) apps. I should explicitly mention that I am not related or employed by any of the apps´s providers.
Interesting Paper: Land-Sparing Agriculture Best Protects Avian Phylogenetic Diversity
A quick post to highlight a new publication in this weeks issue of Current Biology. Edwards et al. went for another piece on the land-sharing/land-sparing debate and presented a very nice case study. Land-sharing is often defined as combining “sustainable” agricultural production with higher biodiversity outcomes often at the tradeoff of harvesting less and loss of natural habitats. Land-sparing on the other hand attempts to prevent remaining natural habitat from being used by humans, but instead intensify production and increase yield from other areas, thus reducing their potential for wildlife-friendly farming. They combined field work from the Choco-andres region (Taxonomic focus: Birds) with simulation models to investigate which strategy might benefit biodiversity the most. Contrary to many other previous publications they focused on phylogenetic richness (PD) rather than “species richness”. Based on landscape simulation models they could show that PD decreases steadily with greater distance to forests, which is interesting because it demonstrates that land-sharing strategies might only be successful, if sufficient amounts of natural habitat are in close proximity, that can act as source habitat for dispersing species.

Source: From Edwards et al. 2015
According to their analysis some species seem to benefit more from land-sparing strategies than others. Specific evolutionary traits thus might be ether beneficial or detrimental for surviving in intensive human land use such as agriculture. They conclude that land-sharing might be of limited benefit without the simultaneous protection of nearby blocks of natural habitat, which can only be achieved with a co-occurring land-sharing strategy.
Further reading: http://www.theguardian.com/science/grrlscientist/2015/sep/03/farming-practices-benefit-tropical-birds-agriculture-sustainability
Playing with Landsat 8 metadata
The Landsat mission is one the most successful remote-sensing programs and has been running since the early 1970s. The most recent addition to the flock of Landsat satellites – Mission Nr. 8 has been supplying tons of images to researchers, NGO’s and governments for over two years now. Providing nearly 400 images daily (!) this has amassed to an impressive dataset of over half a million individual images by now (N = 515243 by 29/07/2015).
Landsat 8 scenes can be easily queried via a number of web-interfaces, the oldest and most successful being the USGS earth-explorer which also distributes other NASA remote-sensing products. ESA also started to mirror Landsat 8 data and so did the great Libra website from developmentseed. Using the Landsat8 before/after tool from remotepixel.ca tool you can even make on the fly comparisons of imagery scenes. You might ask how some of those services are able to show you the number of images and the estimated cloud-cover. This information is saved in the scenes-list metadata file, which contains the identity, name, acquisition date and many other information from all Landsat 8 scenes since the start of the mission. In addition Landsat 8 also has a cloudCover estimate (and sadly only L8, but the USGS is working on a post-creation measure for the previous satellites as far as I know), which you can readily explore on a global scale. Here is some example code showcasing how to peek into this huge ever-growing archive.
# Download the metadata file
l = "http://landsat.usgs.gov/metadata_service/bulk_metadata_files/LANDSAT_8.csv.gz"
download.file(l,destfile = basename(l))
# Now decompress
t = decompressFile(basename(l),temporary = T,overwrite=T,remove=F,ext="gz",FUN=gzfile)
Now you can read in the resulting csv. For speed I would recommend using the “data.table” package!
# Load data.table
if(!require(data.table))install.packages("data.table");library(data.table)
# Use fread to read in the csv
system.time( zz = fread(t,header = T) )
file.remove(t)
The metadata file contains quite a number of cool fields to explore. For instance the “browseURL” columns contains the full link to an online .jpg thumbnail. Very useful to have a quick look at the scene.
require('jpeg')
l = "http://earthexplorer.usgs.gov/browse/landsat_8/2015/164/071/LC81640712015201LGN00.jpg"
download.file(l,basename(l))
jpg = readJPEG("LC81640712015201LGN00.jpg") # read the file
res = dim(jpg)[1:2] # get the resolution
plot(1,1,xlim=c(1,res[1]),ylim=c(1,res[2]),asp=1,type='n',xaxs='i',yaxs='i',xaxt='n',yaxt='n',xlab='',ylab='',bty='n')
rasterImage(jpg,1,1,res[1],res[2])

L8 Thumbnail
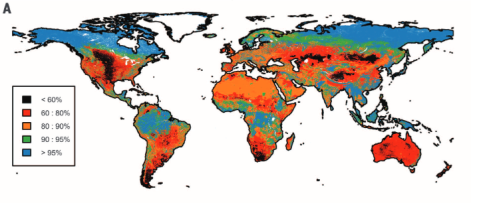
The “cloudCoverFull” column contains the average cloud-cover for each scene, which is interesting to explore as the long-term average of measured cloudCover per region/country likely differs due to different altitude or precipitation levels. Here is a map showing the average cloud-cover per individual scene since mission start:

Average global cloud cover in Landsat 8 data
Clouds are a major source of annoyance for anyone who intends to measure vegetation cover or classify land-cover. Might write another post later showcasing some examples on how to filter satellite data for clouds.
Assessing habitat specialization using IUCN data
Since quite some time ecological models have tried to incorporate both continuous and discrete characteristics of species into their models. Newbold et al. (2013) demonstrated that functional traits affect the response of tropical bird species towards land-use intensity. Tropical forest specialist birds seem to decrease globally in probability of presence and abundance in more intensively used forests. This patterns extends to many taxonomic groups and the worldwide decline of “specialist species” has been noted before by Clavel et al. (2011).

(a) Probabilities of presence of tropical bird species in in different disturbed forests and (b) ratios of abundance in light and intensive disturbed forests relative to undisturbed forests. Forest specialists are disproportionally affected in intensively used forests. Figure from Newbold et al. 2013 doi: http://dx.doi.org/10.1098/rspb.2012.2131
But how to acquire such data on habitat specialization? Ether you assemble your own exhaustive trait database or you query information from some of the openly available data sources. One could for instance be the IUCN redlist, which not only has expert-validated data on a species current threat status, but also on population size and also on a species habitat preference. Here IUCN follows its own habitat classification scheme ( http://www.iucnredlist.org/technical-documents/classification-schemes/habitats-classification-scheme-ver3 ). The curious ecologist and conservationist should keep in mind however, that not all species are currently assessed by IUCN.
There are already a lot of scripts available on the net from which you can get inspiration on how to query the IUCN redlist (Kay Cichini from the biobucket explored this already in 2012 ). Even better: Someone actually compiled a whole r-package called letsR full of web-scraping functions to access the IUCN redlist. Here is some example code for Perrin’s Bushshrike, a tropical bird quite common in central Africa
# Install package
install.packages(letsR)
library(letsR)

# Perrin's or Four-colored Bushshrike latin name
name <- 'Telophorus viridis'

# Query IUCN status
lets.iucn(name)

#>Species        Family Status Criteria Population Description_Year
#>Telophorus viridis MALACONOTIDAE LC Stable 1817
#>Country
#>Angola, Congo, The Democratic Republic of the Congo, Gabon, Zambia

# Or you can query habitat information
lets.iucn.ha(name)

#>Species Forest Savanna Shrubland Grassland Wetlands Rocky areas Caves and Subterranean Habitats
#>Telophorus viridis      1       1         1         0        0           0                               0
#> Desert Marine Neritic Marine Oceanic Marine Deep Ocean Floor Marine Intertidal Marine Coastal/Supratidal
#>      0              0              0                       0                 0                         0
#>  Artificial/Terrestrial Artificial/Aquatic Introduced Vegetation Other Unknown
#>                      1                  0                     0     0       0
letsR also has other methods to work with the spatial data that IUCN provides ( http://www.iucnredlist.org/technical-documents/spatial-data ), so definitely take a look. It works by querying the IUCN redlist api for the species id (http://api.iucnredlist.org/go/Telophorus-viridis). Sadly the habitat function does only return the information if a species is known to occur in a given habitat, but not if it is of major importance for a particular species (so if for instance a Species is known to be a “forest-specialist” ). Telophorus viridis for instance also occurs in savannah and occasionally artificial habitats like gardens ( http://www.iucnredlist.org/details/classify/22707695/0 ).
So I just programmed my own function to assess if forest habitat is of major importance to a given species. It takes a IUCN species id as input and returns ether “Forest-specialist”, if forest habitat is of major importance to a species, “Forest-associated” if a species is just known to occur in forest or “Other Habitats” if a species does not occur in forests at all. The function works be cleverly querying the IUCN redlist and breaking up the HTML structure at given intervals that indicate a new habitat type.
Find the function on gist.github (Strangely WordPress doesn’t include them as they promised)
How does it work? You first enter the species IUCN redlist id. It is in the url after you have queried a given species name. Alternatively you could also download the whole IUCN classification table and match your species name against it 😉 Find it here. Then simply execute the function with the code.
name = 'Telophorus viridis'
data <- read.csv('all.csv')
# This returns the species id
data$Red.List.Species.ID[which(data$Scientific.Name==name)]
#> 22707695

# Then simply run my function
isForestSpecialist(22707695)
#> 'Forest-specialist'
Neutral Landscape model generation with QGIS
There are many interesting things to calculate in relation to landscape ecology and its statistical metrics. However many (if not the majority) of the published toolsets are not reproducible, their algorithm code not published or open-source. Obviously this makes the easy implementation of underlying algorithms even harder for independent developers (scientists) if you don’t have the time to reproduce their work (not to mention the danger of making stupid mistakes, we are all human).
I recently found this new article in Methods in Ecology and Evolution by Etherington et al., who didn’t really present any novel techniques or methods, but instead provided a new python library that is capable of calculating Neutral Landscape Models (NLMs). NLMs are often used as nullmodel counterpart to real remote-sensing derived maps (land-cover or altitude) to test the effect of landscape structure or heterogeneity on a species (-community). Many NLM algorithms are based on cluster techniques, cellular automata or calculating randomly distributed numbers in a given 2d space. There have been critical and considerate voices stating that existing NLMS are often misused and better null-models are needed for specific hypothesis, such as a species perception of landscape structures. Nevertheless NLMs are still actively used and new papers published with it.
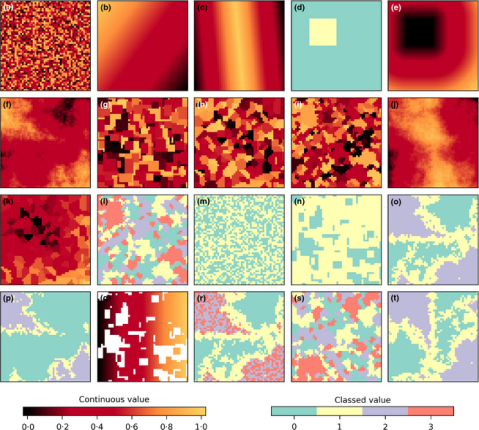
Figure by Etherington et al. showing a number of different NLMs
The new library, called NLMpy, is open source and published under the MIT licence. Thus I can easily use and integrate into QGIS and its processing framework. Their NLMpy library only depends on numpy and scipy and thus doesn’t add any other dependency to your python setup, if you already are able to run LecoS in your QGIS installation. The NLM functions are visible in the new LecoS 1.9.6 version, but only if you have NLMpy installed and it is available in your python path. Otherwise they won’t show up! Please don’t ask me here how to install additional python libraries on your machine, but rather consult google or some of the Q&A sites. I installed it following the instructions on this page.

Midpoint displacement algorithm in QGIS

NLM with randomly clustered landcover patches
After you have installed it and upgraded your LecoS version within QGIS, you should be able to spot a new processing group and a number of new algorithms. Here are some screenshots that show the new algorithms and two NLMs that I calculated. The first one is based on a Midpoint displacement algorithm and could be for instance used to test against an altitude raster layer (need to reclassify to real altitude values first). The second one is aimed at emulating a random classified land-cover map. Here I first calculated a proportional NLM using a random cluster nearest-neighbour algorithm. Second I used the libraries reclassify function (“Classify proportional Raster”) to convert the proportional values (range 0-1) into a relative number of landcover classes with exactly 6 different land-cover classes. Both null model look rather realistic, don’t they 😉
This is a quick and dirty implementation, so there could occur some errors. You should use a meter-based projection as extent (such as UTM) as negative values (common in degree-based projections like WGS84 latitude-longitude) sometimes result in strange error messages. You also have to change the CRS of the generated result to the one of your project manually, otherwise you likely won’t see the result. Instead of the number of rows and columns as in the original implementation, the functions in LecoS are based on a selected extent and the desired output cellsize.
For more complex modelling tasks I would suggest that you use the library directly. To give you a good start Etherington et al. also appended some example code and data in their article´s supporting information. Furthermore a few days ago they even had a spatial MEE blog post with some youtube video demonstrations how to use their library. So it shouldn’t be that hard even for python beginners. Or you could just use the processing interface within LecoS.
In any way, if you use the library in your research, I guess the authors would really appreciate it if you could cite them 🙂
PS:
In addition I also temporarily removed LecoS ability to calculate the mean patch distance metric due to some unknown errors in the calculation. I’m kinda stuck here and anyone who can spot the (maybe obvious) bug gets a virtual hug from me!
PPS:
Happy new year!
Me on Stackexchange

